Complex datasets (such as heterogenous, large-scale, spatiotemporal
data, etc.) are becoming more increasingly accessible, as we are able
to generate, collect and store greater quantities and varieties of
information. However, no single visualization is optimal for all
possible tasks. To address this challenge, a strategy called composite
visualization combine multiple single visual representations in the
same visual space in order to display different aspects of the complex
dataset.
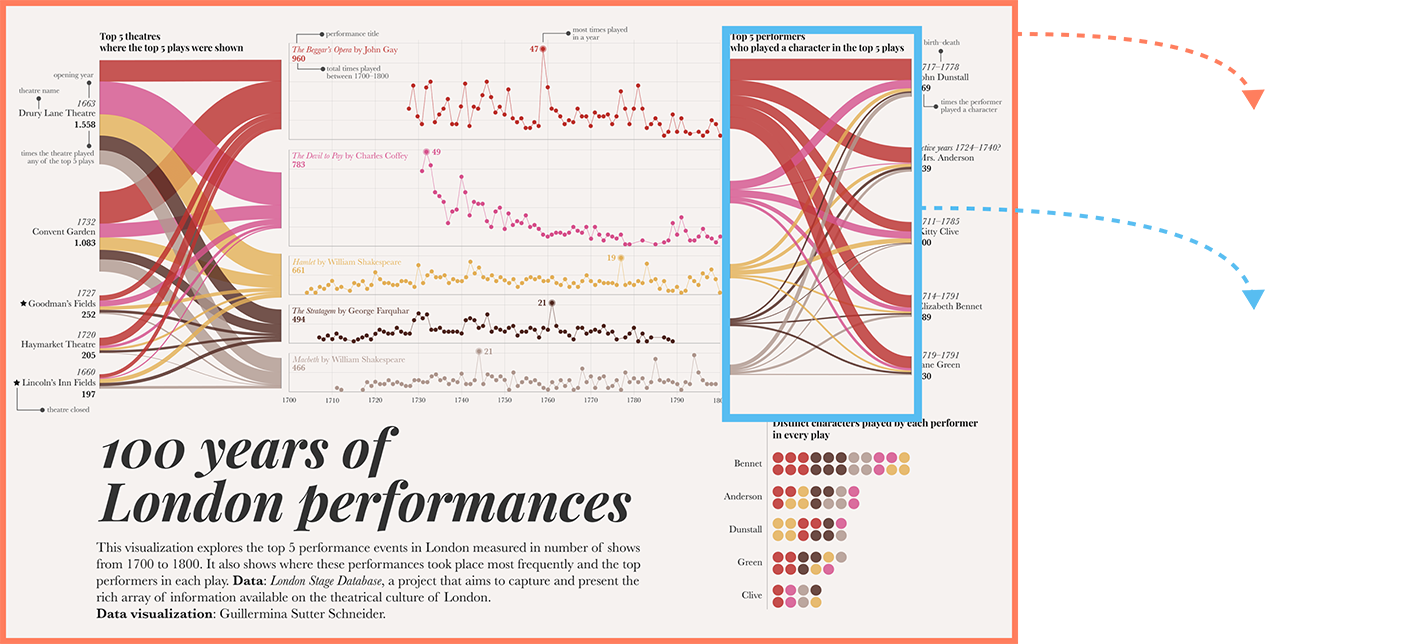
 Fig 1. 100 Years of London Performance by Guillermina Sutter Schneider
Composite visualization consists of multiple component visualizations
and a set of relations between them. This thesis project focuses on
developing a composition framework that identifies ten composition
patterns, based on the relations between component visualizations and
with which we can classify and deconstruct composite visualization.
The thesis starts by contemplating what are the fundamental relations
between component visualizations.
Visual composition of two graphic representations or
combining one with a group of visualizations in the same geometrical
space inevitably requires consideration of the spatial relation
between them.
The figure above depicts five types of spatial relations between shapes
in a two-dimensional geometrical plane, which are included, inscribed,
intersected, circumscribed, and separated. In the context of composite
visualization, the intersection between two components is relatively
rare, so this thesis does not account for this circumstance.
Layering pattern is defined when the spatial relation between two
visualizations is included or inscribed, whereas integration pattern is
defined when the spatial relation between two visualizations is
circumscribed and separated.

Another fundamental relation is data relation. Due to the purpose of combining
multiple visual representations to show the different facets of the dataset,
there must be some inherent data relations between the visualizations
rather than mechanically bringing them together. This thesis specifies
five types of data relation between visualizations, which are listed above.
With two spatial patterns and five types of data relation specified,
this thesis formulates a framework that is a two-by-five matrix that
identifies ten composition patterns, as demonstrated in the figure.
 Fig 4. Brain Drain by Accurat
Item-to-item layering pattern is defined as one visualization overlays
on another visualization that shares related data items. The above
composite visualization is a typical example of this pattern, and
one way to deconstruct it is to break it down into a scatter plot,
a network diagram, and data glyphs. (Click to view more information about
composition patterns and corresponding examples)
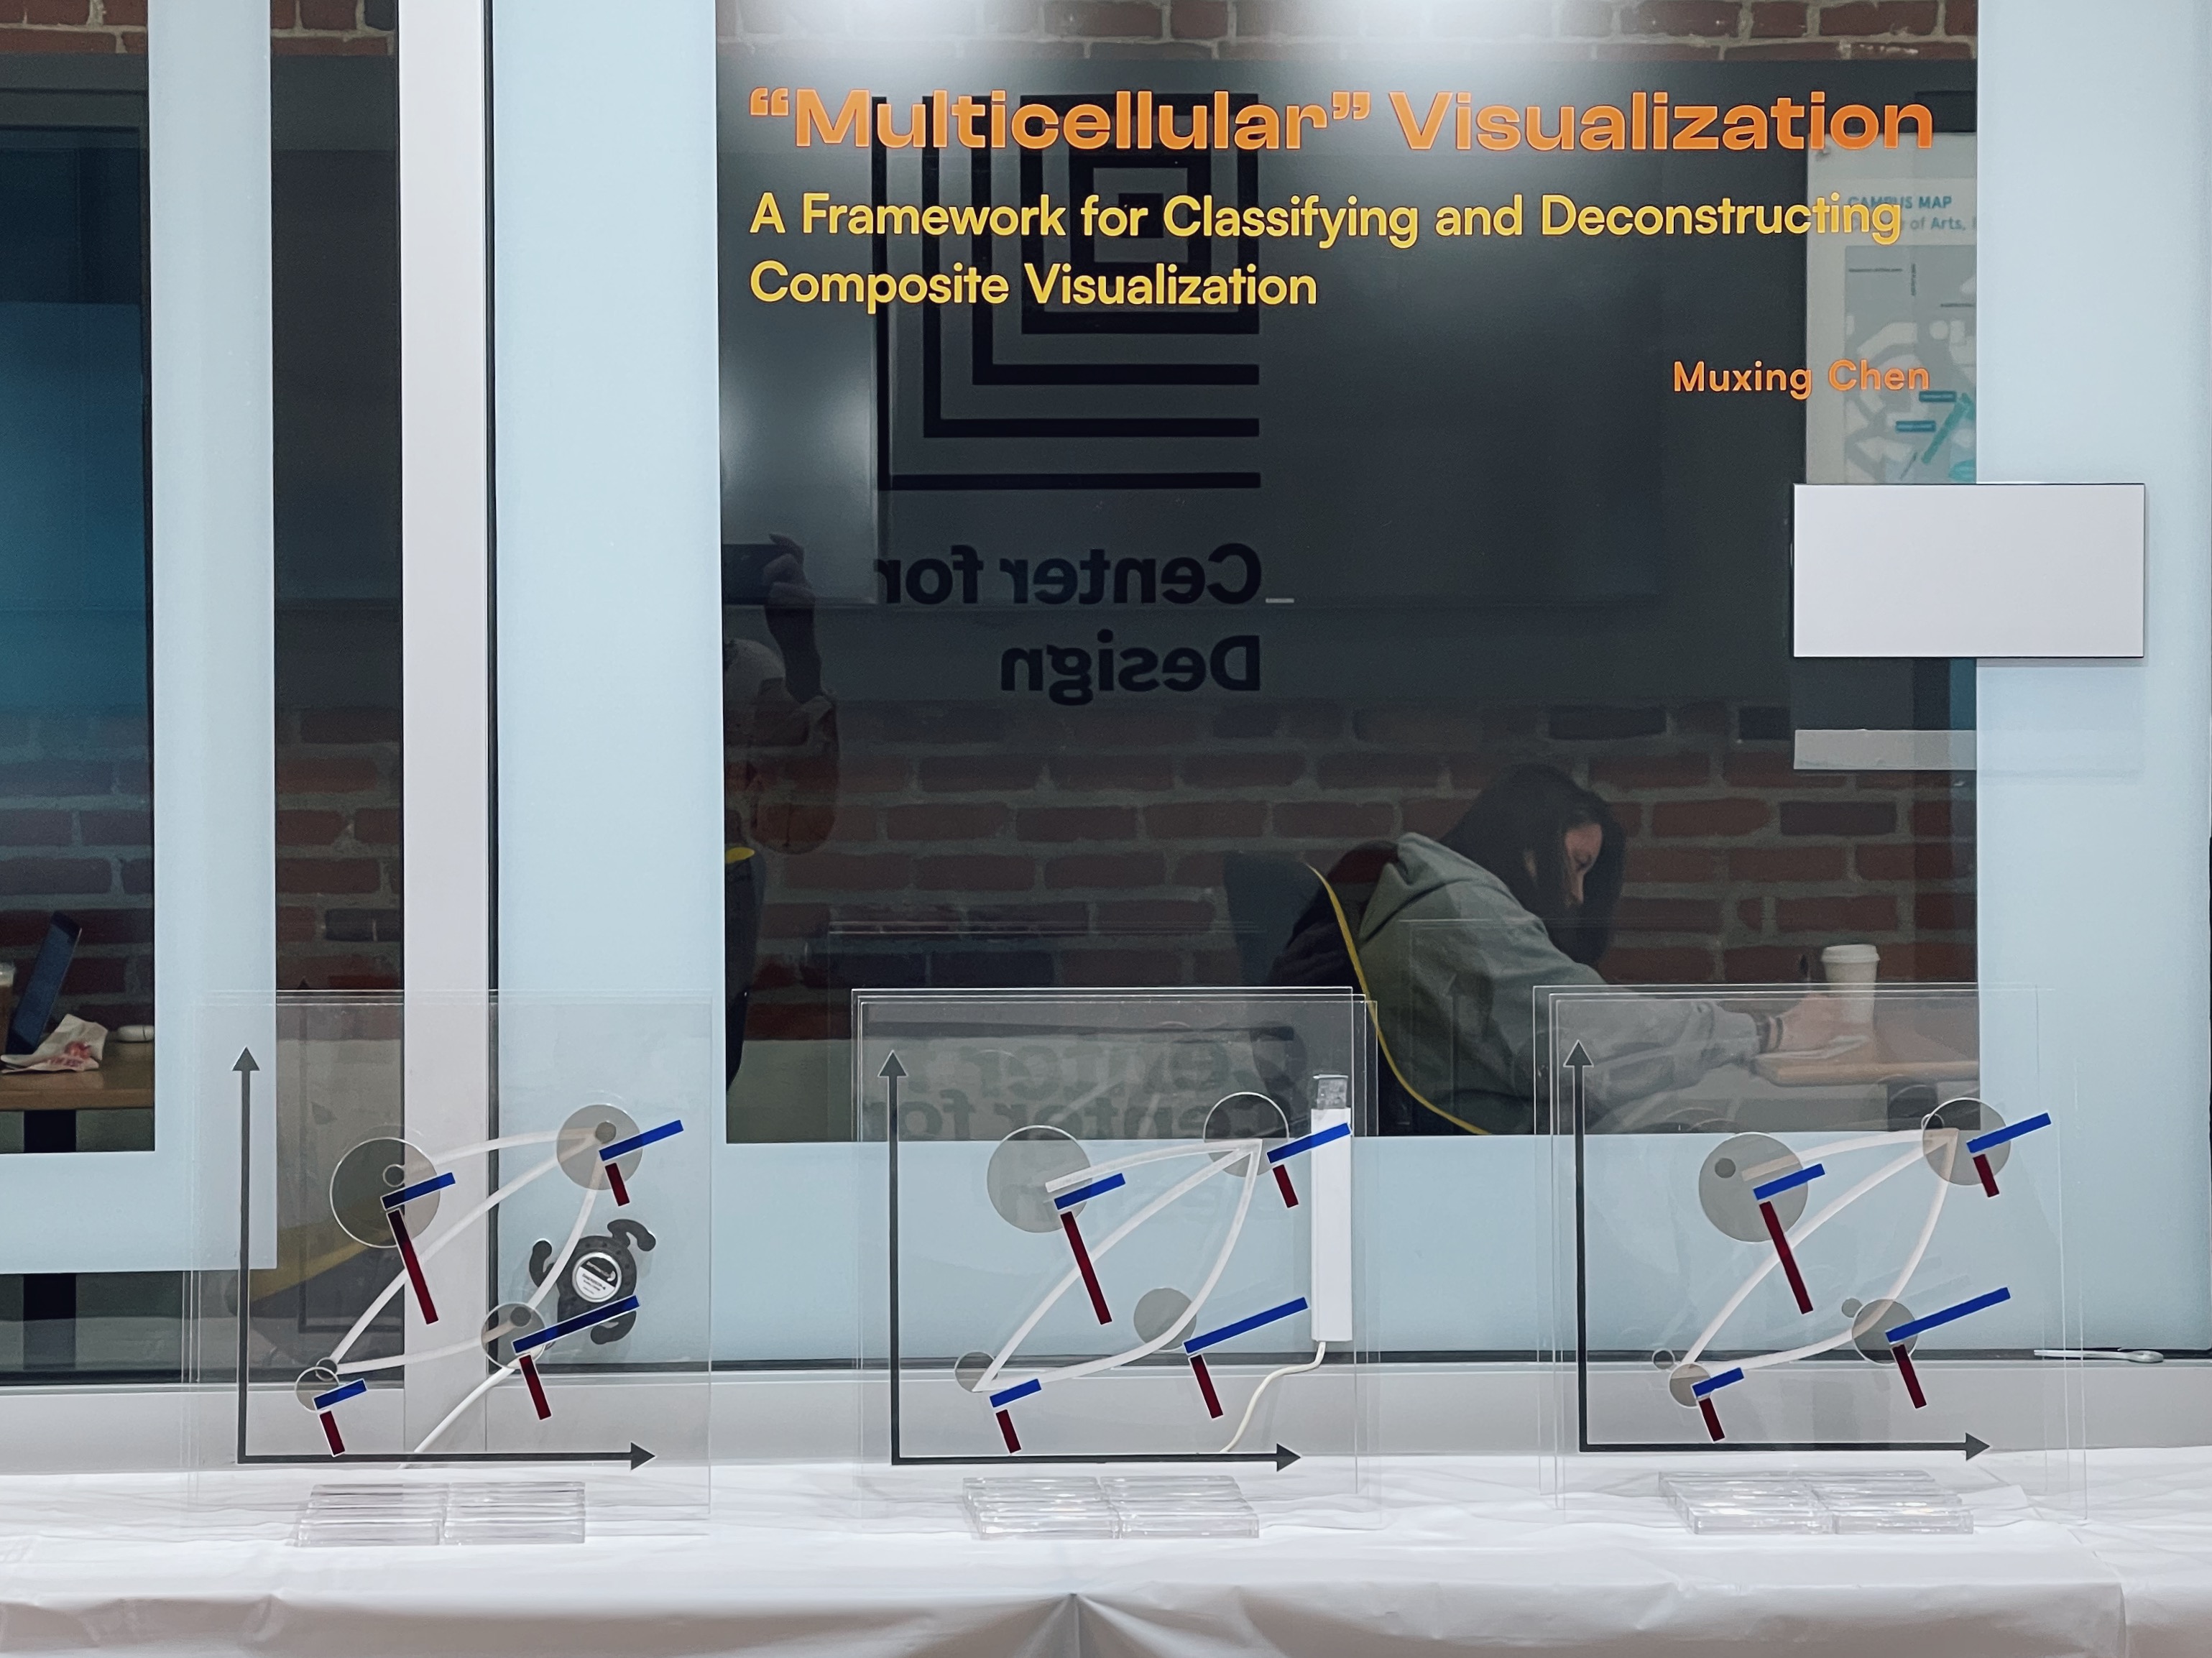
 Fig 5. Front view of the installation
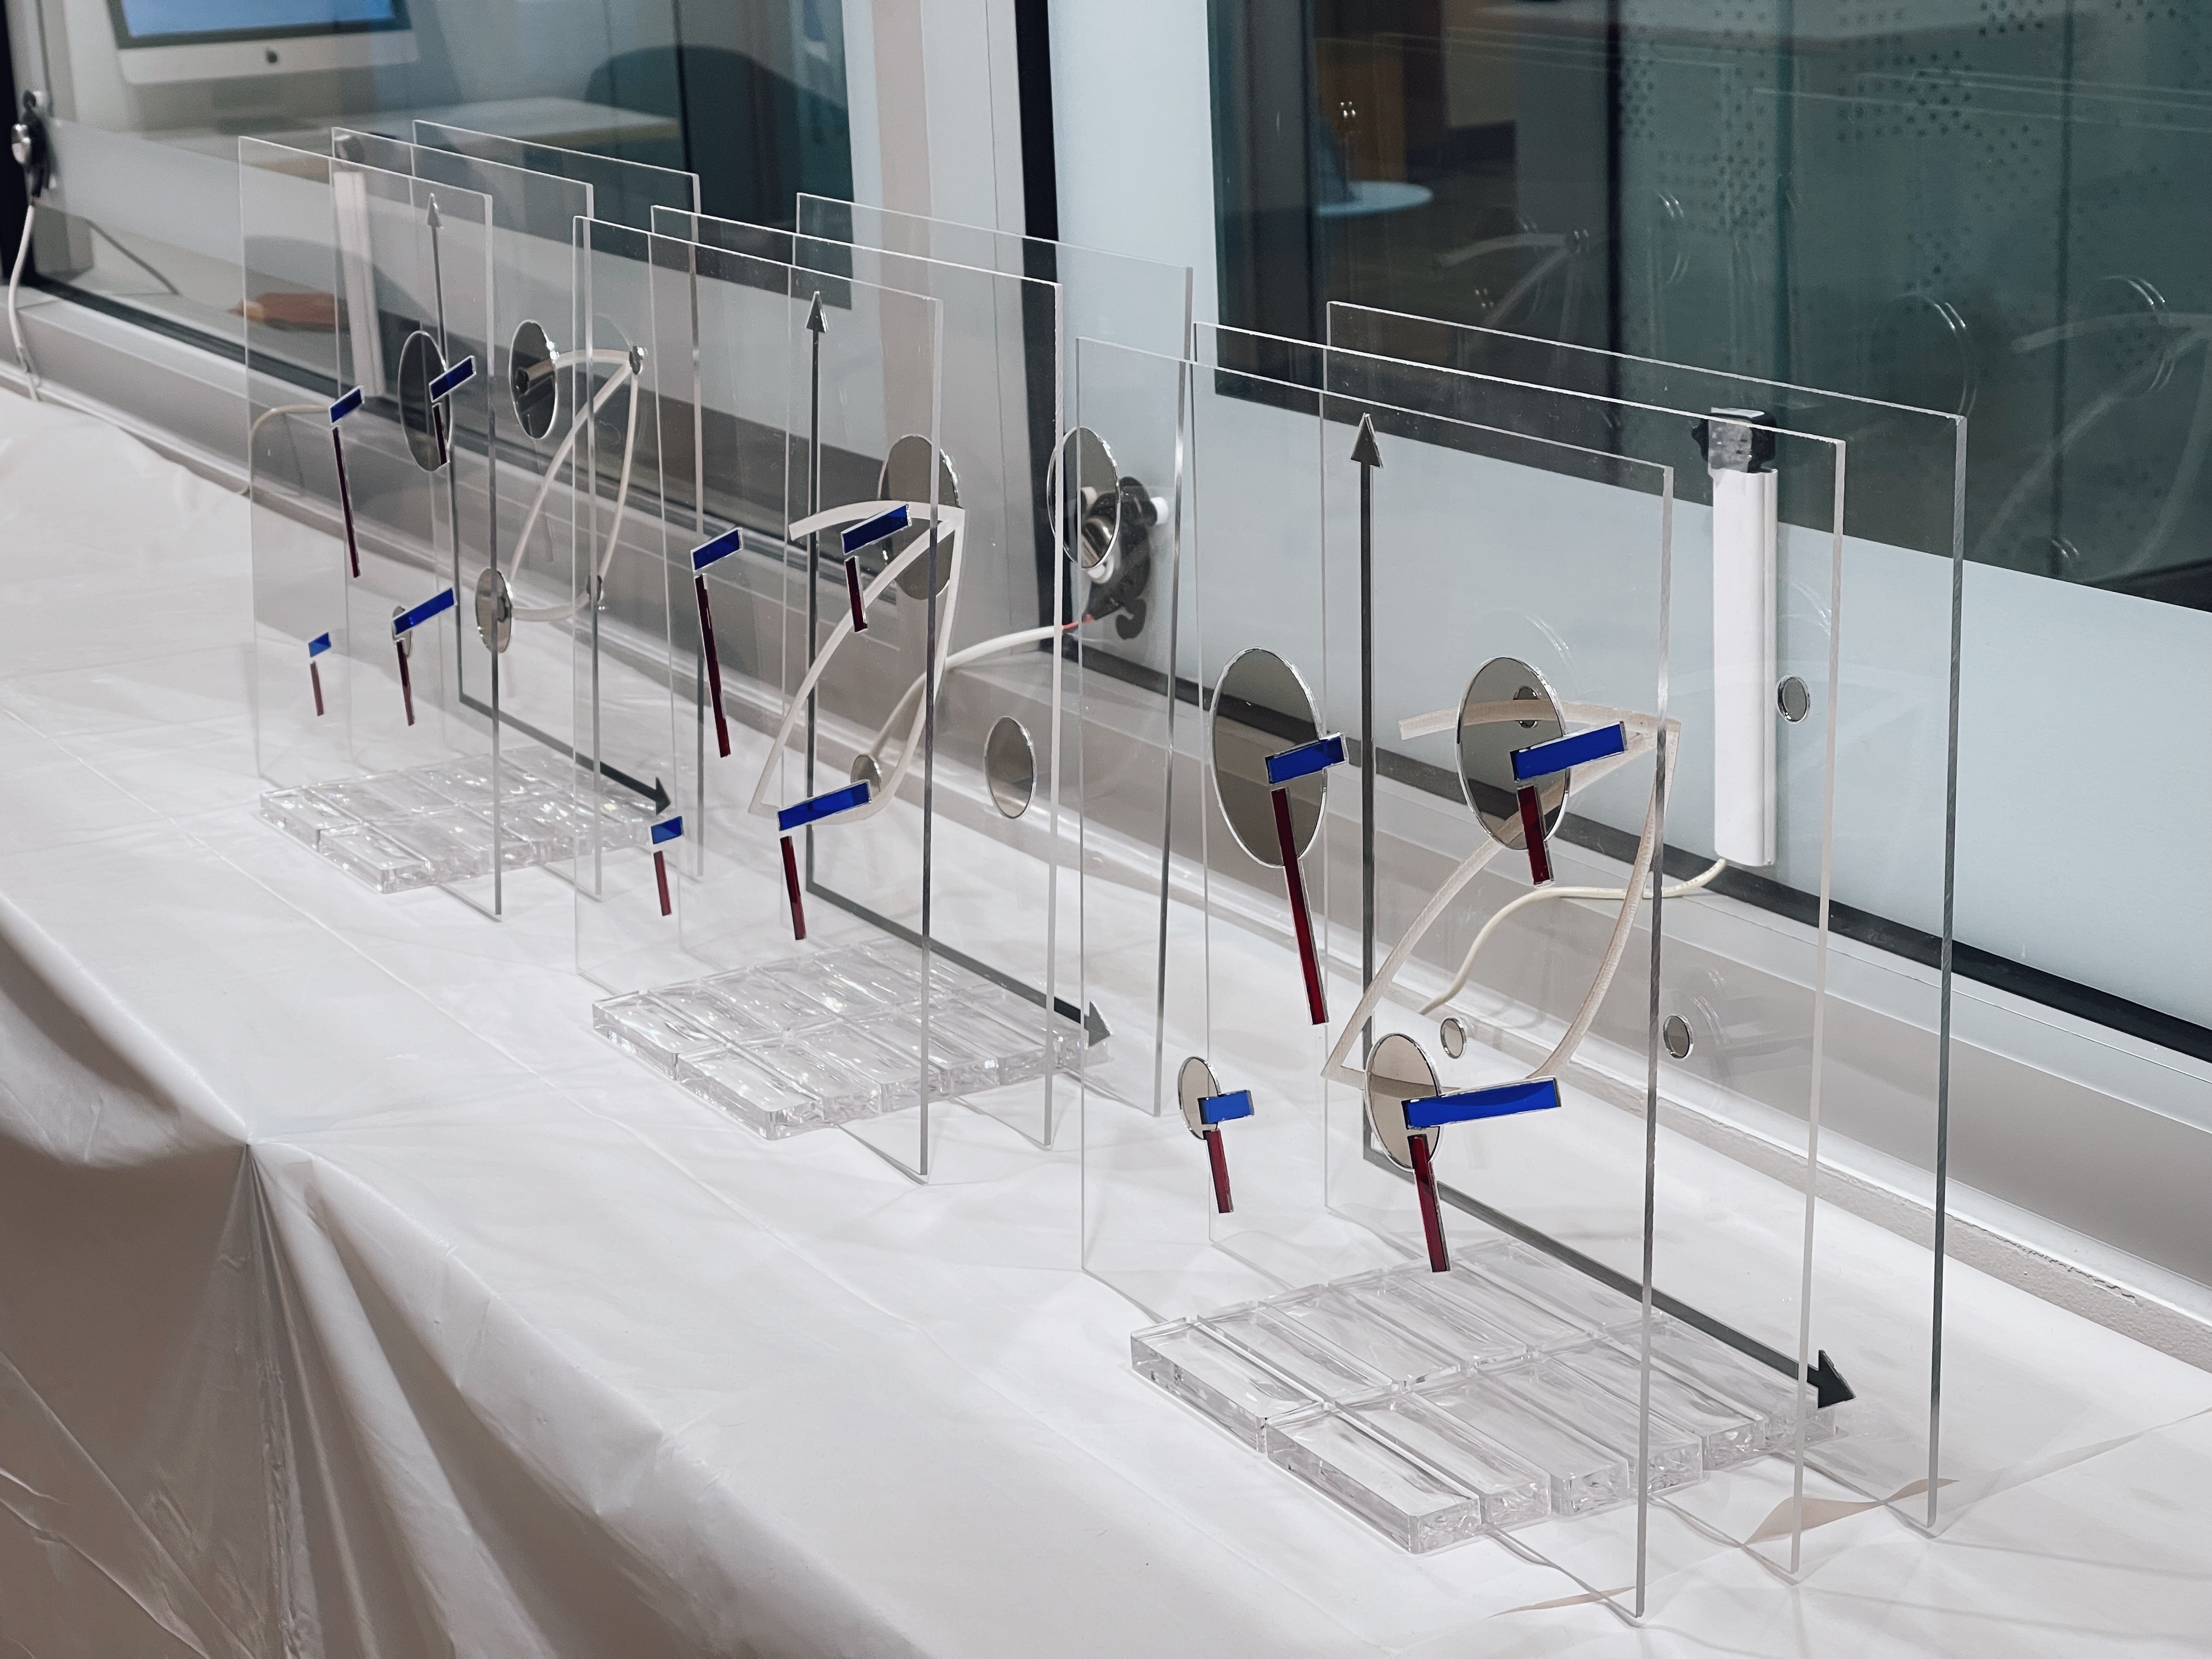
 Fig 6. Side view of the installation
Inspired by Exploring the Brain Drain, this exhibited physical artifact
reveals the ambiguity of composite visualization deconstruction. Three
sets of acrylic sheets display three possible ways to deconstruct the
same composite visualization (as seen from the front). Visual elements
distribute differently on three layers of each set (viewed from the sides).
There is currently no consensus and guidelines on how to deconstruct
composite visualizations, which makes communicating the deconstruction
of composite visualization equivocal. For example, this visualization can
also be broken down into a bubble chart, a network diagram, and data glyphs.


